Devpost
Participate in our public hackathons
Devpost for Teams
Access your company's private hackathons
Grow your developer ecosystem and promote your platform
Drive innovation, collaboration, and retention within your organization
By use case
Blog
Insights into hackathon planning and participation
Customer stories
Inspiration from peers and other industry leaders
Planning guides
Best practices for planning online and in-person hackathons
Webinars & events
Upcoming events and on-demand recordings
Help desk
Common questions and support documentation
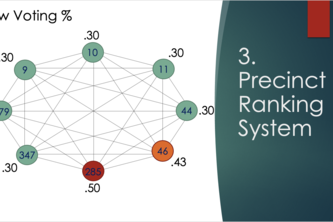
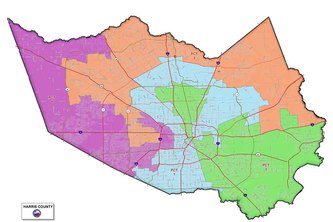
Our project aims to visualize the impact of BakerRipley's efforts on the November election in Harris County, and provide insight on how to more effectively promote voter turnout.
This project solves the Chevron challenge for 2k23 Rice Datathon
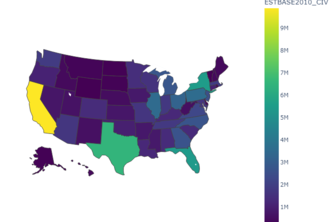
Predicting and analyzing the most eco-friendly states in the United States.
We analyzed Baker Ripley's 2022 election data.
Attempt to do the Bill.com challenge
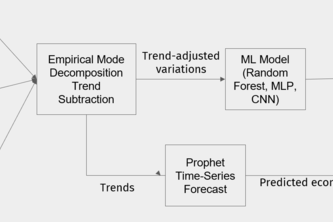
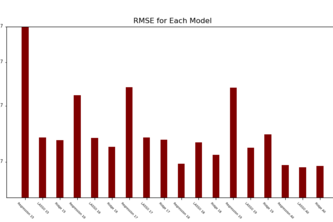
Prediction of Renewable Energy Investments by Analyzing The US Economy using EMD and Random Forest
Visualizing data provided by BakerRipley to illustrate data story-telling.
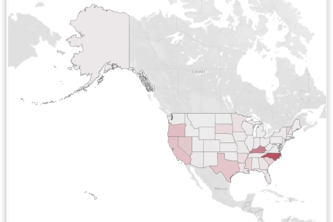
Analyze the data provided to find gaps in facility coverage. Determine the necessity of coverage based on selected parameters. Identify where we would allocate the hypothetical facilities to.
We use green energy investment data from 2015 to 2019 by state to build a machine learning model to predict 2020 investment by states.
Ever wonder which state you should invest in for renewable energy? Look no further than here!
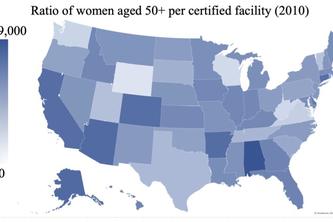
To successfully complete the project, we cleaned the given datasets, created data visualizations with different plots like bar plots, histograms, choropleth plots, etc and performed data analysis.
Give me a receipt image. I can help you find the matching record from transaction tables in seconds!
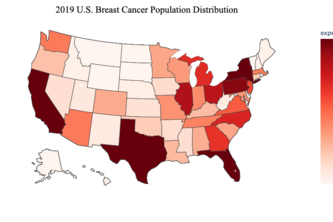
Using the given datasets, we determined gaps in national mammography coverage in order to help the FDA allocate hospital mammography certification funds.
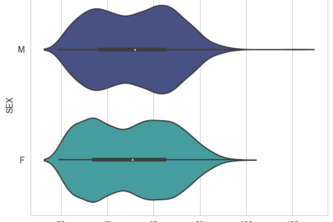
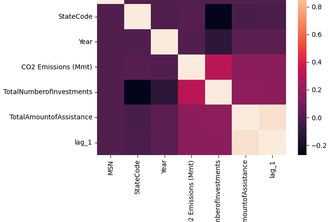
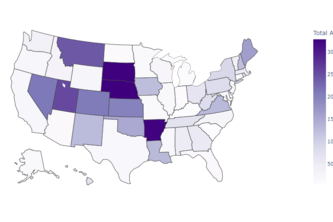
We attempted to predict government assistance to states based on energy usage statistics. We used various machine learning models to see what factors were most important in predicting this.
Beginner Challenge Entry - Analyzing the Location of Mammogram Facilities in the US to Assist in Allocating CDC Funding
FAFAFA
In this project we use python OCR libraries to read text from receipts so that we can match them to a database of manually entered receipt data. We think this to be robust model for Bill.com to use.
Optimize mammogram allocation for the FDA to maximize impact. Calculated expected deathrate per facility. Performed data visualization on US map
Provided investment prediction for chevron challenge based on more than 5 models and analysis of potential regions for 2020 investment.
All freshman team - Cleaning and analyzation of mammography facility data
Datathon project for Rice 2023 Datathon
Our goal is to help users understand the power of contrasts when building UI/UX. Our model opens accessibility options and advances a brand's ability to be read and distinguished at a glance.
Beginner's Track! First Datathon! We would like to accurately analyse the useful data so that we can use it for creating graphs that would intuitive for the FDA to read.
25 – 47 of 47